
Electric fleet management: EV telematics
May 31, 2026 · Suso Merino · CEO
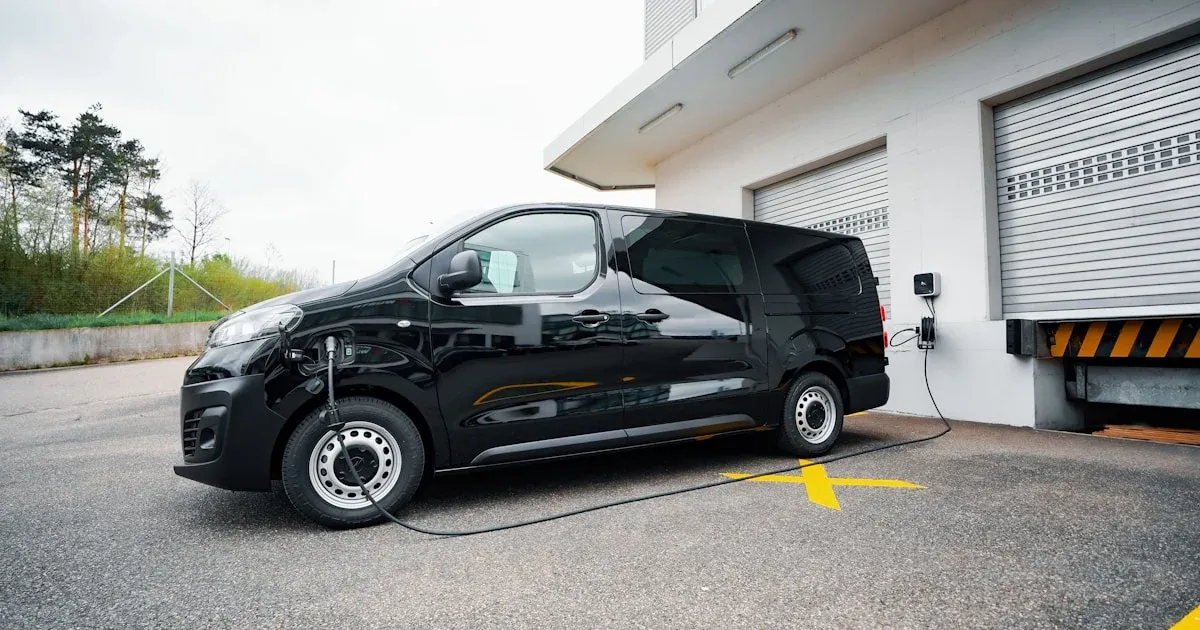
A poorly managed electric van costs more per kilometer than an equivalent diesel one. It sounds counterintuitive, but it happens often in fleets that electrify without measuring. Excessive fast charging that degrades the battery in 2-3 years instead of 8, route planning that doesn’t account for real-world range, kWh counted differently at every charger, vehicles returning to the hub with 12% battery because nobody is monitoring. EV telematics isn’t optional if electrification is going to pay off.
The questions you need to answer in an EV fleet are different from those in a diesel fleet. And the data the device captures shifts in priority. Here’s what gets measured, how it’s planned and where the honest technical limits lie.
What changes compared with a combustion fleet
In diesel, the king metric is liters/100 km and the critical data point is the engine DTC code. In electric, everything changes:
- Liters disappear; kWh/100 km comes in: the equivalent consumption metric. An eSprinter-type van consumes between 22 and 35 kWh/100 km depending on load, route and weather.
- Mechanical maintenance drops drastically: there are no oil changes, fuel filters or clutch. But battery maintenance, pack cooling systems and battery management software come in.
- Range replaces the tank: the driver doesn’t have a guaranteed 600 km but an estimate that varies with weather and driving.
- Charging replaces refueling: going from filling up in 4 minutes to having to plan 6-8 hours of overnight charging or 30-45 minutes of fast charging is a profound operational change.
- The engine DTC gives way to battery status: SoC (State of Charge, % charged) and SoH (State of Health, health relative to the original 100%) are the critical data points.
What EV telematics measures, specifically
A well-configured tracker in an electric vehicle should capture at least:
| Metric | What it indicates | Useful frequency |
|---|---|---|
| SoC (% battery) | Remaining charge in real time | Every 30-60 seconds on the road |
| SoH (% battery health) | Cumulative pack degradation | Daily reading |
| Consumption kWh/100 km | Real efficiency by route and driver | Per trip |
| Regenerative efficiency | % of energy recovered when braking | Per trip |
| Total charging time | Hours on AC and DC charging | Per session |
| Charging type (AC/DC) | Slow overnight vs. fast daytime | Per session |
| Pack temperature | Heat during fast charging | Every 30 seconds while charging |
| Cumulative charge cycles | Counts toward service life | Daily reading |
With these signals you build the operational KPIs: cost per km, cost per kWh charged, fast vs. slow charging ratio, monthly degradation, average effective range by model and by driver.
Charging planning: the heart of the operation
In diesel, refueling is a one-off, 4-minute event. In electric, charging is a structural operation and it consumes vehicle time. There are three strategies, and most fleets combine all three:
Overnight charging at the hub
This is the most cost-effective option. The vehicle returns to the hub at the end of the day with 15-30% battery and charges all night at medium power (7-22 kW AC). Advantages: a much cheaper nighttime electricity rate (around €0.08-0.12/kWh vs. €0.18-0.28 at peak), it’s gentle on the battery, and the vehicle is ready at 100% by 7 a.m. It requires charging infrastructure at the hub, usually one charger per vehicle, or one per 1.5 vehicles with good planning.
Opportunity charging at the destination
The vehicle charges at the customer’s home, in a public parking lot or in the customer’s own parking area while making the delivery or performing the service. It’s usually slow AC charging (3.7-11 kW). It adds range without taking up productive time. It works well for field service with 1-3-hour stops at the customer.
DC fast charging on the road
50 kW, 150 kW or 350 kW chargers that take the battery from 20% to 80% in 25-45 minutes. It’s the emergency and long-route option, not the default. Each fast-charging session amounts to between 0.5 and 2 cycles of accelerated pack aging, depending on the system and the temperature.
The operating rule that almost any well-managed EV fleet applies: 80% overnight charging at the hub, 15% opportunity charging at the destination, 5% fast charging on the road. If the share of fast charging rises above 15%, the cost per km and pack degradation shoot up.
Real-world range vs. WLTP range
Manufacturers’ spec sheets publish WLTP range (Worldwide Harmonised Light Vehicles Test Procedure). It’s the European type-approval cycle, done in a lab at 23 °C, with no payload, no air conditioning and at a moderate average speed. A fleet’s reality is different.
Typical drops versus WLTP under real-world conditions:
| Condition | Range drop vs. WLTP |
|---|---|
| Payload at 80% | 8-12% |
| Air conditioning or heating | 10-20% |
| Ambient temperature below 5 °C | 15-25% |
| Sustained highway driving at 110-120 km/h | 20-30% |
| Winter + highway + payload combined | 35-45% |
A van rated at 300 km WLTP can deliver between 165 and 195 real kilometers on a January day at 0 °C, loaded and at 110 km/h. If the planned route is 220 km with no charging stop along the way, the vehicle gets stranded. Useful telematics doesn’t just measure consumption; it also builds expected range by model, by season and by driver, and warns before departure if the planned route is outside the reasonable range.
Cost per kilometer: how to calculate it properly
The question every fleet director asks when evaluating electrification: does it pay off? The answer depends on how you calculate cost/km. Components to include:
- Charging cost: kWh consumed at the hub (nighttime rate) plus kWh consumed on fast chargers (public charger or operator rate).
- Vehicle depreciation: net price minus residual value, divided by years and kilometers.
- Depreciation of the hub’s charging infrastructure: chargers, civil works, meter, divided by years and vehicles.
- Maintenance: annual service, tires, brakes (which last 2-3 times longer in EVs thanks to regenerative braking), pack coolant.
- Insurance: usually 5-15% more expensive than combustion because of the vehicle’s value.
- Taxes: a reduced vehicle tax in many Spanish municipalities, reduced tolls on some highways, VAT recoverable just the same.
A well-managed eSprinter-type electric van (80% hub charging at €0.10/kWh) comes out at between €0.11 and €0.16/km in energy. The diesel equivalent at 8 liters/100 km and €1.55/liter comes out at €0.124/km in fuel. The electric van breaks even or wins on energy and clearly wins on maintenance. Where it loses is on depreciation if the TCO isn’t calculated over 7-8 years.
There’s a direct correlation between good telematics and profitability: fleets that measure cost/km per vehicle quickly identify the 2-3 vehicles running above average and take action (driver training, route adjustment, change of charging pattern).
Hardware: what works and what doesn’t
On an EV, the telematics device plugs into the OBD port just as on a combustion vehicle. The Teltonika FMM003 and FMC003 devices we use read the vehicle bus and extract the standard signals: position, speed, acceleration, idling (which loses its meaning on an EV) and, in many cases, SoC and consumption. It works well on:
- European vehicles with standard OBD: Mercedes eSprinter, Renault Master E-Tech, Peugeot e-Boxer, Citroën e-Jumper, Stellantis (Fiat e-Ducato), Maxus eDeliver 9, Iveco eDaily.
- Most European premium cars.
- Some Asian models with full OBD-II.
Where there are honest limitations:
- Tesla: doesn’t expose data via standard OBD. Reading the battery and kWh requires integration with Tesla’s official Fleet API, which is done on the fleet’s account. Position and GPS events do work with a standard tracker.
- Volkswagen ID. Buzz and recent MEB platforms: expose little via legacy OBD. The recommended integration is with VW’s We Connect Fleet API.
- Newly imported Chinese vehicles (BYD, new Maxus models): the OBD is sometimes incomplete. It’s worth validating with the device before buying.
In practice, a mixed fleet of European vans works very well with standard hardware. A fleet with Teslas or ID. Buzz vans in the mix requires additional native integration, which is available but involves a project.
As with combustion vehicles, the patterns the maintenance model detects are different but just as valuable: abnormal battery degradation, declining regenerative efficiency (a sign of a problem in the power electronics), consumption drifting away from the fleet average. The idea is the same as predictive maintenance for fleets, applied to the battery pack and the electronics.
Specific KPIs worth tracking monthly
In monthly EV fleet review meetings, these six KPIs account for 90% of decisions:
- Average kWh/100 km by model and by driver: identifies inefficient drivers and vehicles with problems.
- % of energy regenerated out of total consumed: an indirect indicator of anticipatory driving. Typical values: 12-25%.
- Average pack SoH by age: expected vs. actual degradation. If a pack at 18 months has an SoH below 92%, there’s an anomaly.
- Fast charging vs. total ratio: if it exceeds 15%, review your planning.
- Average time at the hub outside working hours: shows whether the charging infrastructure is sufficient.
- Energy cost per km per vehicle: comparing vehicles of the same model brings operational problems to the surface.
Conclusion
Telematics for electric fleets isn’t a cosmetic extra. It’s what separates profitable electrification from electrification with a higher cost/km than diesel. Measure battery health, plan charging sensibly, watch degradation and translate it all into a real cost per kilometer per vehicle.
The hardware works well on most European EVs via standard OBD. There are honest limitations with Tesla, the ID. Buzz and some recent Chinese models, where additional native integration is needed. If you’re electrifying and want to see exactly which data we can read on the models you have, get in touch and we’ll validate it on a real vehicle before you commit to a full rollout.