
How to reduce breakdowns in a truck fleet
May 16, 2026 · Suso Merino · CEO
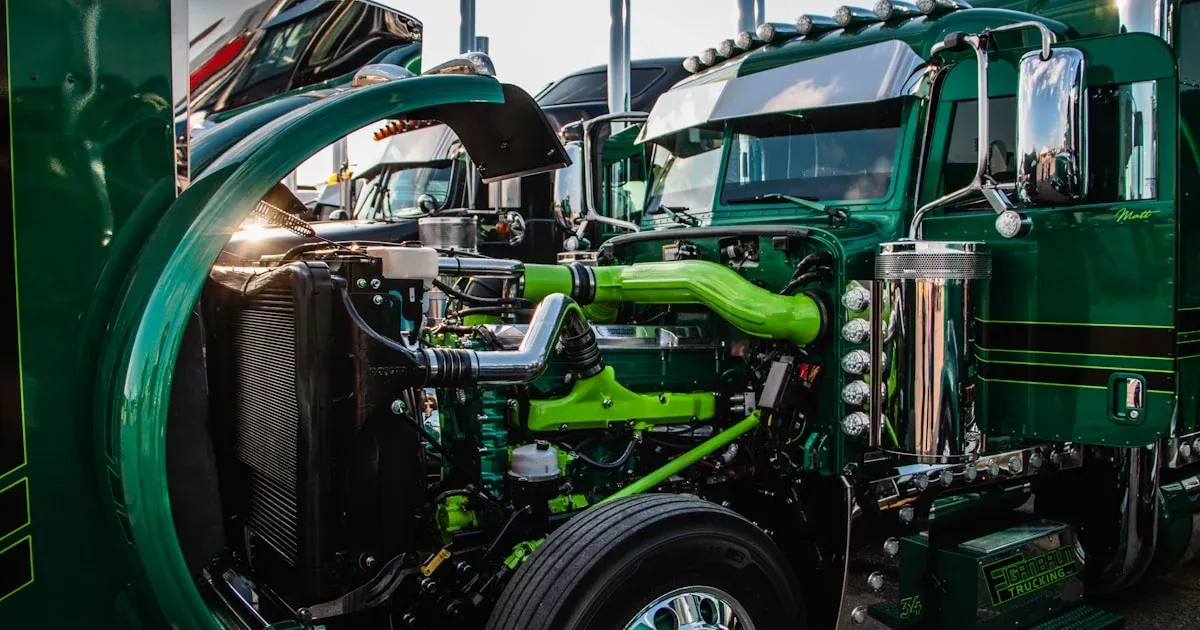
A roadside breakdown of a heavy truck costs on average between €4,000 and €7,500 once you add up towing, the workshop, affected cargo, late-delivery penalties and unbilled service during the days the vehicle is off the road. In fleets of 30 to 100 vehicles, incidents like these number in the dozens every year. The fleet manager’s question isn’t whether all of them can be avoided (they can’t), but how many can be anticipated by working well.
The honest answer is: between 30% and 40% of serious breakdowns can be eliminated with five levers combined. None of them moves the needle enough on its own. Let’s go through them one by one.
1. Predictive maintenance with real telematics data
Maintenance by mileage and calendar date is the historical standard, but it creates two problems: it replaces components that still have useful life left (unnecessary extra cost) and it lets through parts that are failing early (roadside breakdown). Predictive maintenance changes the equation by reading the vehicle’s actual condition at every moment.
In a modern truck with a Teltonika FMC003 connected to the OBD-II port or directly to the J1939 CAN bus, the device continuously reads dozens of engine parameters: coolant temperature, oil pressure, battery voltage, DTC codes, turbo pressure, engine hours, instantaneous fuel consumption, RPM, percentage load. That telematics data reaches the platform every few seconds and feeds the AI models.
Which breakdowns it anticipates
- Battery failures: a sustained voltage drop during cold starts over several days. Typical warning window of 2 to 4 weeks.
- Engine overheating: coolant temperature above what’s expected under similar conditions (load, gradient, ambient). Window of hours to days.
- Worn clutch: slippage detectable from the difference between engine RPM and expected speed in high gears.
- Dirty injectors or filters: a gradual drop in combustion efficiency and rising fuel consumption on a known route.
- Brakes: in trucks with full CAN-bus data, wear estimated from pedal pressure and usage pattern.
To understand in detail how the models are trained and what data they need, see the guide to predictive maintenance for fleets.
2. Replace consumables by actual engine hours, not by calendar
The classic mistake in construction truck, tanker or urban vehicle fleets that spend a lot of time idling is scheduling oil changes “every 6 months” or “every 30,000 km.” A truck that logs 600 engine hours idling because it works with a hydraulic unloading system accumulates wear equivalent to an extra 18,000 km that the odometer doesn’t show.
The right metric for engine consumables is actual engine-on hours, which telematics reports precisely. Changing the oil filter and oil at the hours recommended by the manufacturer (typically between 400 and 600 hours depending on make and application) instead of by mileage reduces premature wear on the engine block and, with it, the likelihood of a serious breakdown.
The same applies to the fuel filter, hydraulic fluids and the automated transmission itself.
3. Early detection of abnormal patterns
Beyond classic mechanical failures, there’s a group of faults that don’t announce themselves with a clean DTC code but with gradual changes in the vehicle’s behavior. This is where the combination of telematics + AI delivers real value.
Three concrete, everyday examples:
| Symptom detected | Probable diagnosis | Preemptive action |
|---|---|---|
| Sustained 8-12% rise in fuel consumption on the same route | Clogged air filter, dirty injector, low tire pressure | Workshop check at the next scheduled stop |
| Increased vibration measured by the device’s accelerometer | Bearing wear, wheel imbalance | Check before a long trip |
| Engine temperature 5-8 °C above the historical average | Failing thermostat, fan, low coolant | Cooling system inspection |
None of these cases necessarily lights up the warning light on the dashboard. Without historical telematics and a model that compares current behavior against the vehicle’s normal pattern, they go unnoticed until the failure is complete and expensive.
4. Driver scoring and driving habits
A very significant share of mechanical breakdowns isn’t random: there’s a driver behind them. Habitual harsh braking punishes pads, discs and suspension. Aggressive acceleration drives up fuel consumption and wears the drivetrain. Unnecessary prolonged idling speeds up wear on injectors and oil. Poorly timed gear changes punish the gearbox and clutch.
A driver scoring system takes these events and normalizes them by distance driven so that drivers can be compared fairly. The resulting metric isn’t meant to penalize (that discourages honest reporting and creates resistance), but to identify two types of cases:
- Drivers with clear room for improvement: they’re offered targeted training. The investment in a day of eco-driving training pays for itself in 4-6 months on fuel alone, not counting reduced wear.
- Vehicles systematically assigned to drivers who put them under heavy mechanical stress: rotation or reassignment to less demanding routes.
Fleets that apply honest scoring (visible and explained to the drivers) see 12-18% reductions in harsh braking and aggressive acceleration in the first 90 days, which translates directly into fewer transmission and brake breakdowns.
5. Auditing your maintenance provider
This is the uncomfortable lever. A not-insignificant share of recurring breakdowns in fleets comes from workshops that repair without diagnosing, that replace components instead of identifying the root cause, or that use non-original spare parts without saying so.
Three signs to audit your maintenance provider:
- Repeat repairs of the same fault on the same vehicle within 12 months: if it happens more than 8-10% of the time, there’s a systemic problem.
- Downtime above the industry average: a scheduled service shouldn’t keep the vehicle in the workshop for more than 36-48 hours. If it always does, something isn’t being managed properly.
- No technical report with each job: any serious workshop provides a report with the DTC codes read, measurements, parts used with part numbers and the reason for each replacement. If all you get is an invoice with no technical breakdown, you can’t audit anything.
Telematics data is key here because it gives you the objective version: how many kilometers the vehicle drove, which DTC codes appeared, when they were cleared. If the workshop says “we replaced the turbo due to overheating” but the telematics never recorded an abnormal temperature, it’s time to talk.
6. Strategic purchasing: better parts, fewer times
The sixth lever complements the previous five and is usually poorly managed in fleets with decentralized purchasing. When each workshop buys spare parts on its own with no brand or quality policy, the fleet ends up with a mix of components of very mixed origin: cheap filters that last half as long, water pumps with no warranty, generic pads that squeal and wear unevenly.
A centralized purchasing policy with two or three reference brands for each type of consumable reduces recurring breakdowns and, above all, makes reliability statistics comparable across vehicles. If all the filters are the same brand and two vehicles fail early, you know the problem isn’t the part; it’s something about the vehicle or how it’s used.
The extra cost of buying original or equivalent top-tier parts versus generic ones is typically 15-30%, but service life nearly doubles and the rate of premature failure drops. All told, a good part costs less.
The ROI of combining the levers
A fleet of 50 medium-duty trucks (3.5 t to 18 t) that moves from purely corrective maintenance + calendar-based preventive maintenance to a predictive + scoring + workshop audit model typically sees:
- Reduction in serious roadside breakdowns: 30-40%
- Reduction in average downtime: 15-25%
- Reduction in fuel spend thanks to driving habits: 8-12%
- Payback on hardware + software investment: 8-14 months
The investment in Teltonika hardware is modest compared with the savings: around €110-160 per vehicle for the device depending on the model, plus installation. Which device suits each case is covered in detail in the comparison of the Teltonika FMM003, FMC003 and the Eye family.
If you’d like to see how all this fits your specific fleet and what real numbers you can expect, we offer a personalized demo with data from your industry and fleet size. You can request it through the contact form or first take a detailed look at the maintenance module.